One of the first things I tackled at Ness was a MetCoal futures reporting platform for MVS. The project had been started before I joined the company and I needed to restore the client’s faith in Ness along with continuing the project from where it had been left by my predecessor.
Complex Charts
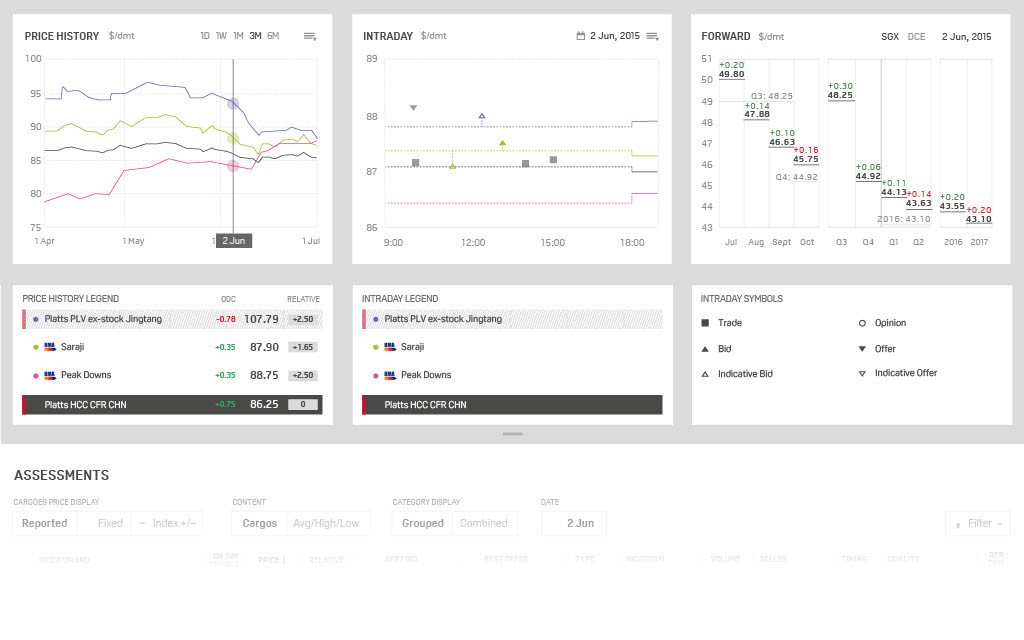
Because of the nature of the subject matter, I had to make some complex charts. Firstly I had to learn the conventions of working both with futures and the MetCoal market to understand how charts are read and which symbols mean what.
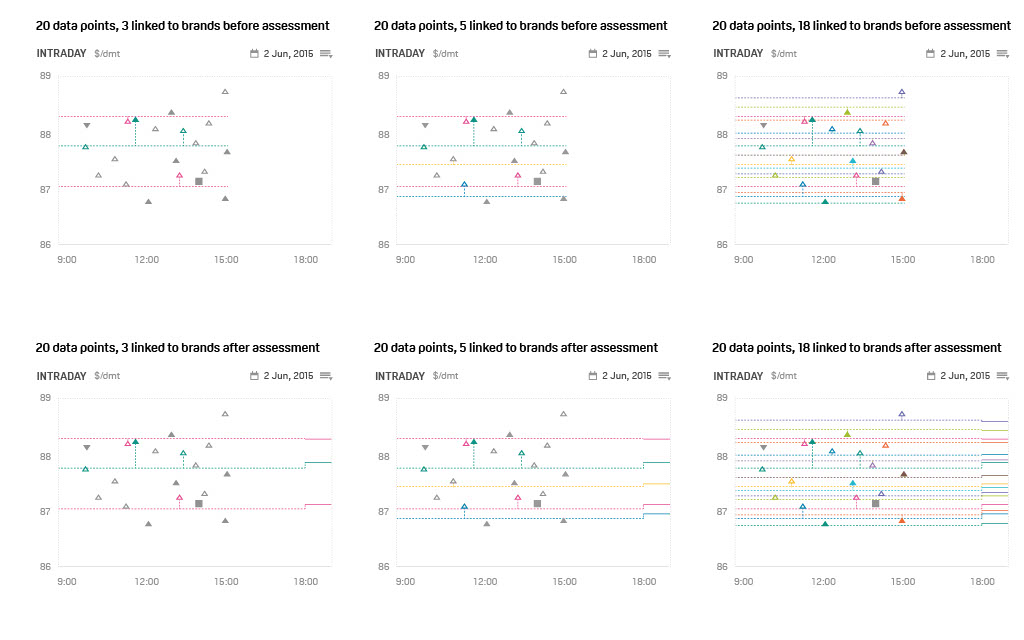
From there I was able to start building colour and load tests for the charts
Layering Information
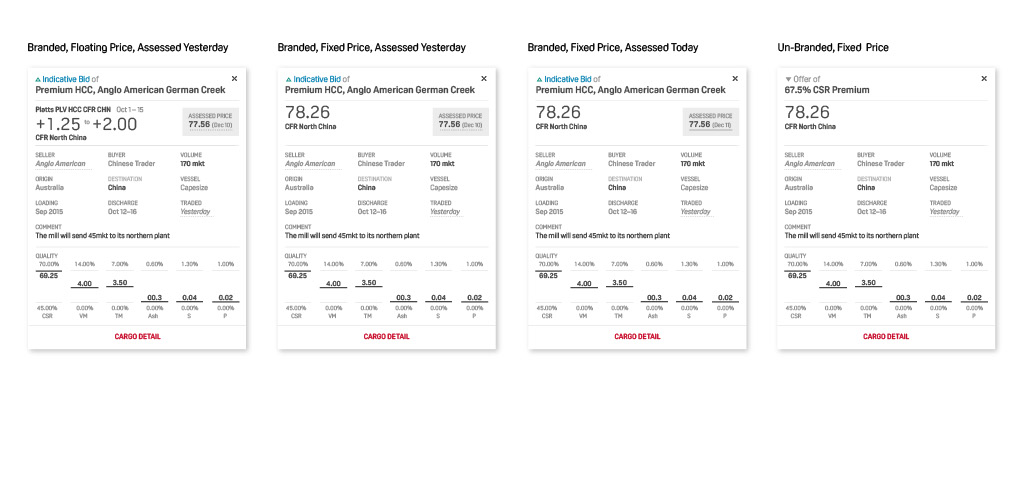
To keep the charts as readable as possible I kept quite a lot of information out but, for more detailed decision-making, this information is still needed so I added them back in the form of overlays and legends. This meant that, once the user had set the charts up to suit the way they like to work, they can get an overview by simply glancing at the chart or get more detailed information by hovering over the chart or clicking a specific data point.